Written and Created by PM Coach Joshua Gordon, PhD
This calculator and analysis draws from a vast dataset of 769 races and over 1 million individual race results to estimate full Ironman race durations based on half-distance performances. By considering factors like age, continent of residence, and temperature variances, it aims to provide athletes with valuable predictive insights for race preparation. Estimating race durations aids in crafting effective training plans, nutrition strategies, and pacing approaches, optimizing performance and mental preparation. Unlike running's established equivalency systems, triathlon lacks a similar formulaic approach, prompting a deeper exploration into the fatigue dynamics specific to Ironman racing. The methodology, dataset, segmentation, modeling techniques, outcomes, and practical implications are systematically discussed, offering valuable insights for athletes preparing for endurance races.
Calculate Your Full Ironman Finishing Time
Please click here to open calculator in new tab and enter your data.

Never finished a 70.3? Check out my newer blog on predicting your Ironman Time from a Marathon (Published June 1, 2024): https://www.precisemultisport.com/blogs/predicting-your-ironman-performance-from-your-best-marathon
Introduction
Contemplating a full Ironman race and uncertain about the duration it might take you to complete? Many athletes find themselves in this predicament, questioning their endurance and capability to finish a full-distance event. I'm here to offer guidance on estimating your race duration based on your half-distance performance. In this blog, I'll delve into a comprehensive approach for estimating race times by analyzing empirical data from 769 races and 1,040,487 individual race results. This analysis considers crucial factors like age, continent of residence, and the temperature variance between your best 70.3 performance and the expected or average temperature of the full Ironman race you intend to compete in.
This discussion holds paramount significance for several reasons. Firstly, having an estimated race duration aids in devising a well-informed training and racing strategy. Tailoring your long training sessions, especially bike rides and runs, to simulate the anticipated fatigue on race day becomes more feasible with a clearer understanding of your estimated race duration. Secondly, it helps in planning nutrition intake—both the overall quantity and the distribution per hour—essential for sustaining energy levels throughout the race.
Furthermore, this analysis serves as a mental preparation tool. Understanding the expected race duration enables effective pacing strategies, ensuring that you optimize your performance by leaving minimal energy untapped at the finish line. Lastly, it offers insights into the upper bounds of achievable race times, empowering you to race as efficiently as possible. By estimating your race duration, this analysis aims to equip you with the foresight needed for comprehensive race preparation, helping you perform optimally and handle the challenges of a full Ironman race more effectively.
In the world of running, extensive research has focused on race equivalency, notably exemplified by Jack Daniels' VDOT system, a renowned tool in running training. This system was introduced in Jack Daniels' Running Formula and utilizes a runner's fitness level, derived from race performances, to prescribe specific paces for varied training intensities and distances. However, unlike running, there lacks an equivalent formulaic approach in triathlon. My aim here is to shed light on the intricate process of how the body fatigues in the context of Ironman triathlon racing.
Fatigue modeling in triathlon involves a complex interplay of scientific factors, encompassing physiological, psychological, and environmental elements, including the impact of temperature. This comprehensive modeling integrates principles from exercise physiology, neuroscience, biomechanics, and psychology to comprehend and prognosticate the onset, progression, and recovery from fatigue. Models like VDOT in running often consider factors such as energy expenditure, muscle fatigue, and neurochemical changes.
This post is structured as follows: In Section 1, I will delineate the dataset utilized for this analysis, detailing the preprocessing steps, participant selection criteria, and race selection methodologies. Section 2 will introduce various data segmentation approaches, delineating representative bins aimed at segmenting users for analysis. Section 3 will delve into different data modeling techniques, introducing an intuitive method selected to generate the results. Subsequently, in Section 4, the outcomes derived from the methodology presented in Section 3 will be expounded upon based on the criteria introduced. Section 5 will amalgamate segmentations outlined in Section 4 to offer deeper insights into specific subcategories. Moving forward to Section 6, key takeaways from the analysis will be discussed, elucidating ways to apply the knowledge presented to enhance one's Triathlon racing experience. Additionally, Section 7 will explore sensitivity analysis and areas meriting further investigation.
Given the vast expanse of this dataset spanning nearly a decade and comprising hundreds of thousands of results, we can reasonably estimate Ironman finish times based on your half Ironman finishing time, offering a valuable predictive insight for athletes preparing for such endurance races.
Section 1: Ironman 70.3 and Ironman 140.6 Data
I sourced the dataset from endurace-data.com using a custom Python scraper. Feel free to reach out to me for access to the processed data or for any additional questions relevant to potential analysis. Upon acquiring the comprehensive dataset, I conducted an exhaustive exploratory data analysis, scrutinizing the distributions of Swim, Bike, Run, and Total Finishing times. Notably, within this expansive dataset, I encountered extraordinary individuals—some of whom completed over 20 full Ironmans within an 8-year span—though delving into their stories merits a separate blog post.
Before estimating the time difference between a full Ironman and a half Ironman, I encountered several issues that necessitated data trimming and preprocessing. These included: (a) races lacking a swim segment, (b) races featuring shortened bike or swim sections, (c) races involving downriver swims that distorted the model, and (d) timing chip issues such as missing bike split data despite having total time recorded. Following data trimming, some key summary statistics for the dataset are as follows:
-
Span of Years:
-
From 2015 to 2023
-
-
Number of Events:
-
703 Events: 516
-
1406 Events: 255
-
Number of Distinct Cities:
-
703 Events: 184 cities
-
1406 Events: 71 cities
-
Number of Athletes Completing Both (1+) 703 and (1+) 1406 :
-
Total unique athletes: 77,580
-
Number of Athletes Completing Only 703 or Only 1406:
-
477,680
-
Number of Distinct Participants by Continent of Residence/Origin:
-
Africa: 2,088
-
Asia: 6,082
-
Europe: 99,586
-
North America: 138,056
-
Oceania: 2,952
-
South America: 15,376
Image 1: Map of Ironman and Ironman 70.3 Locations
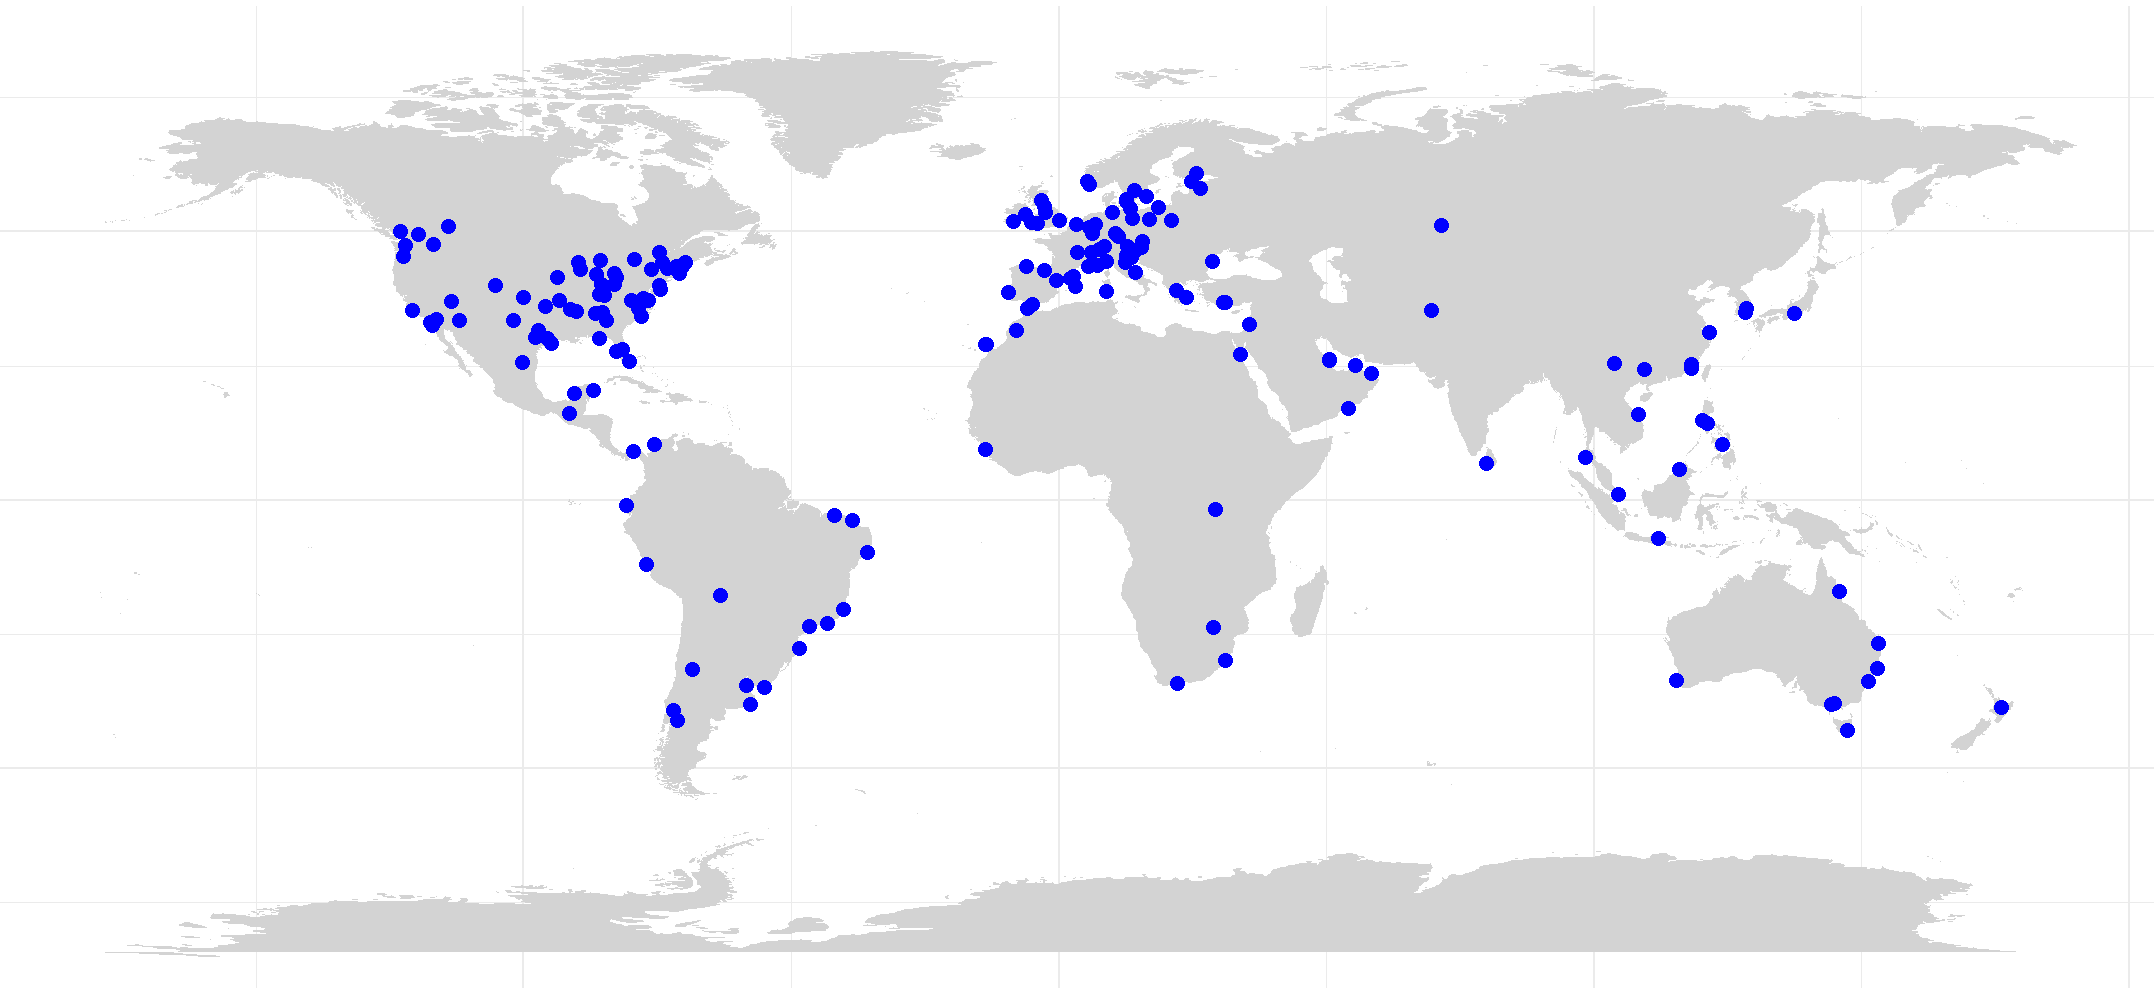
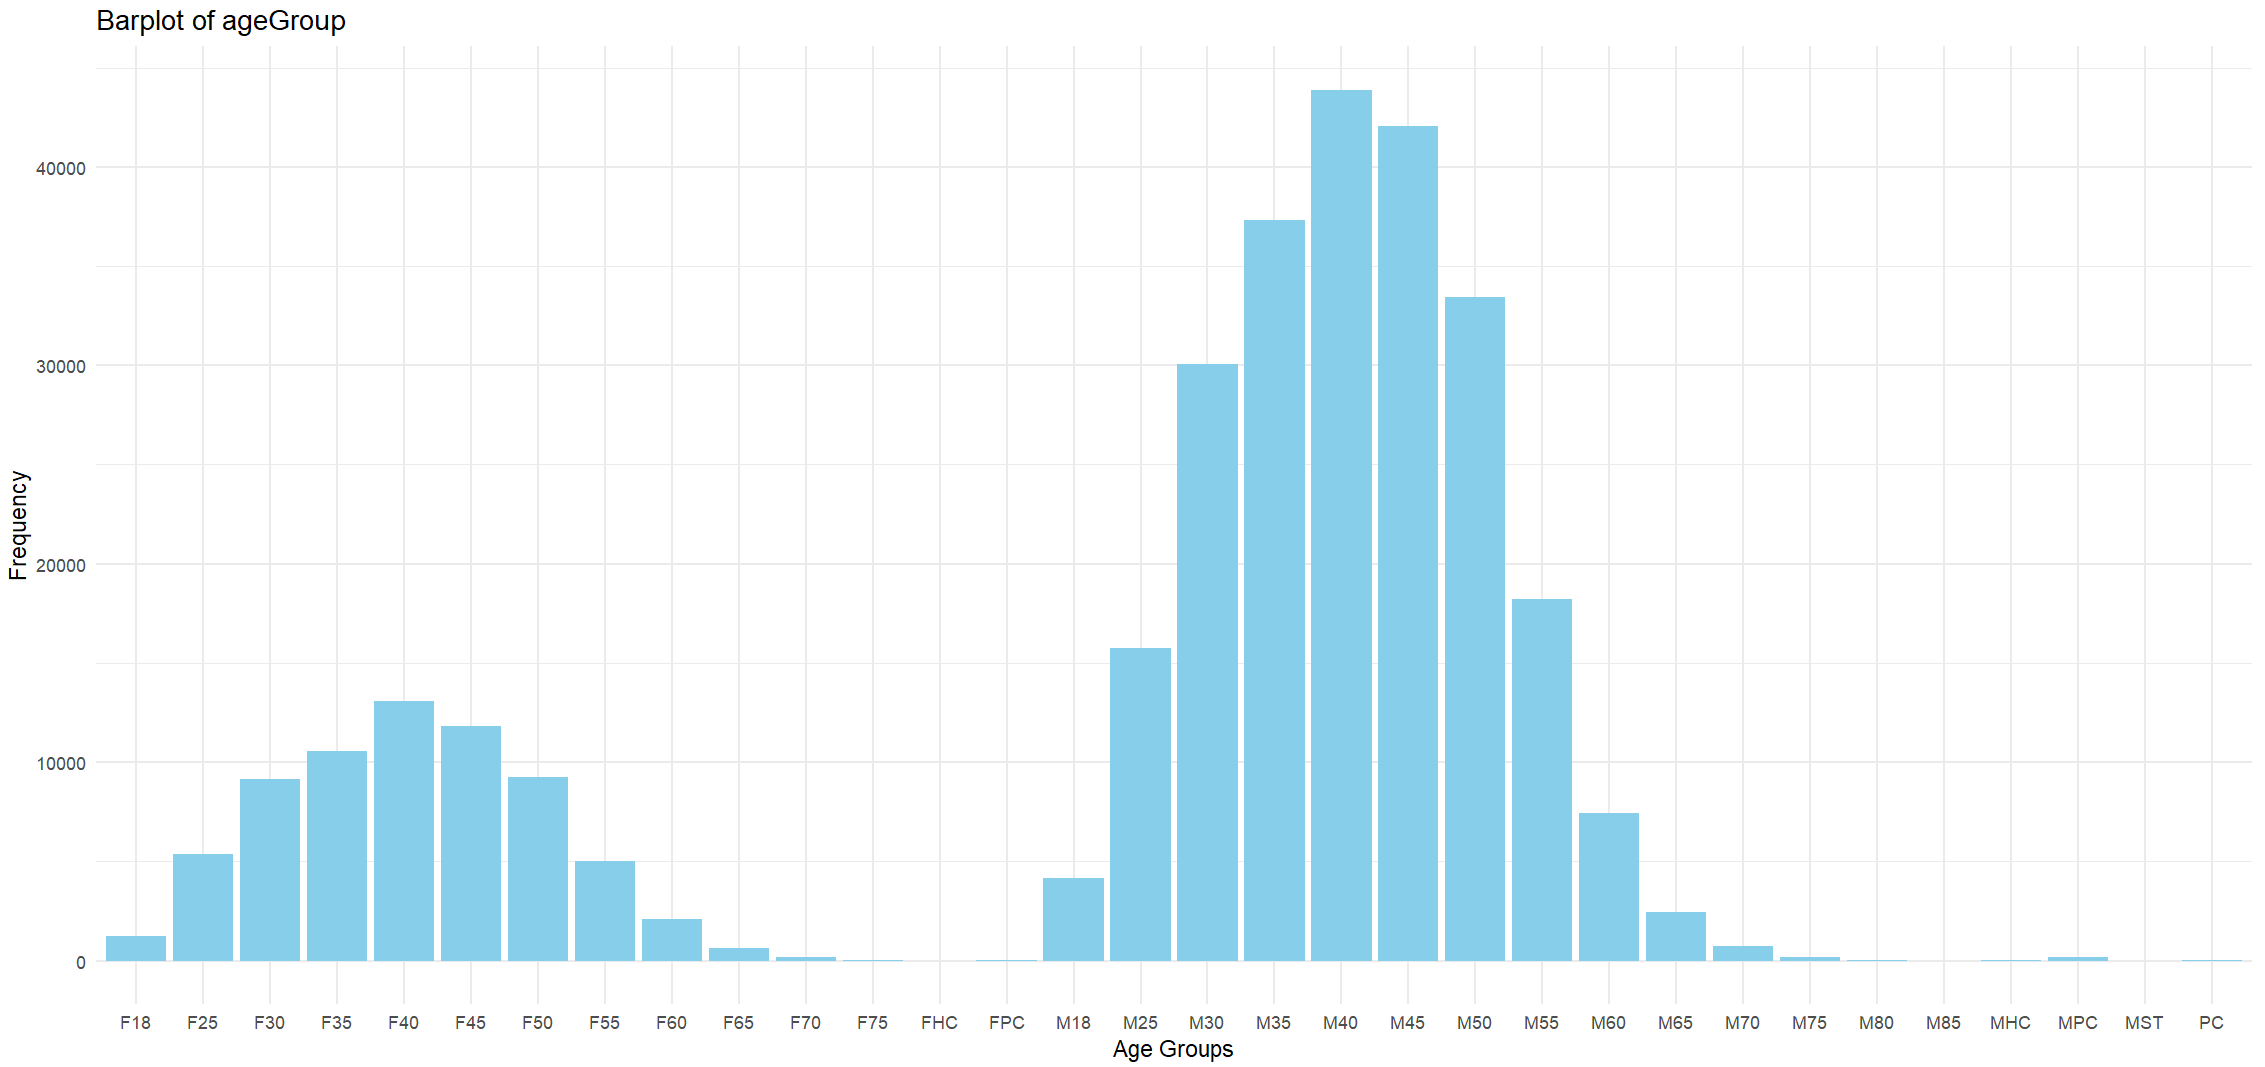
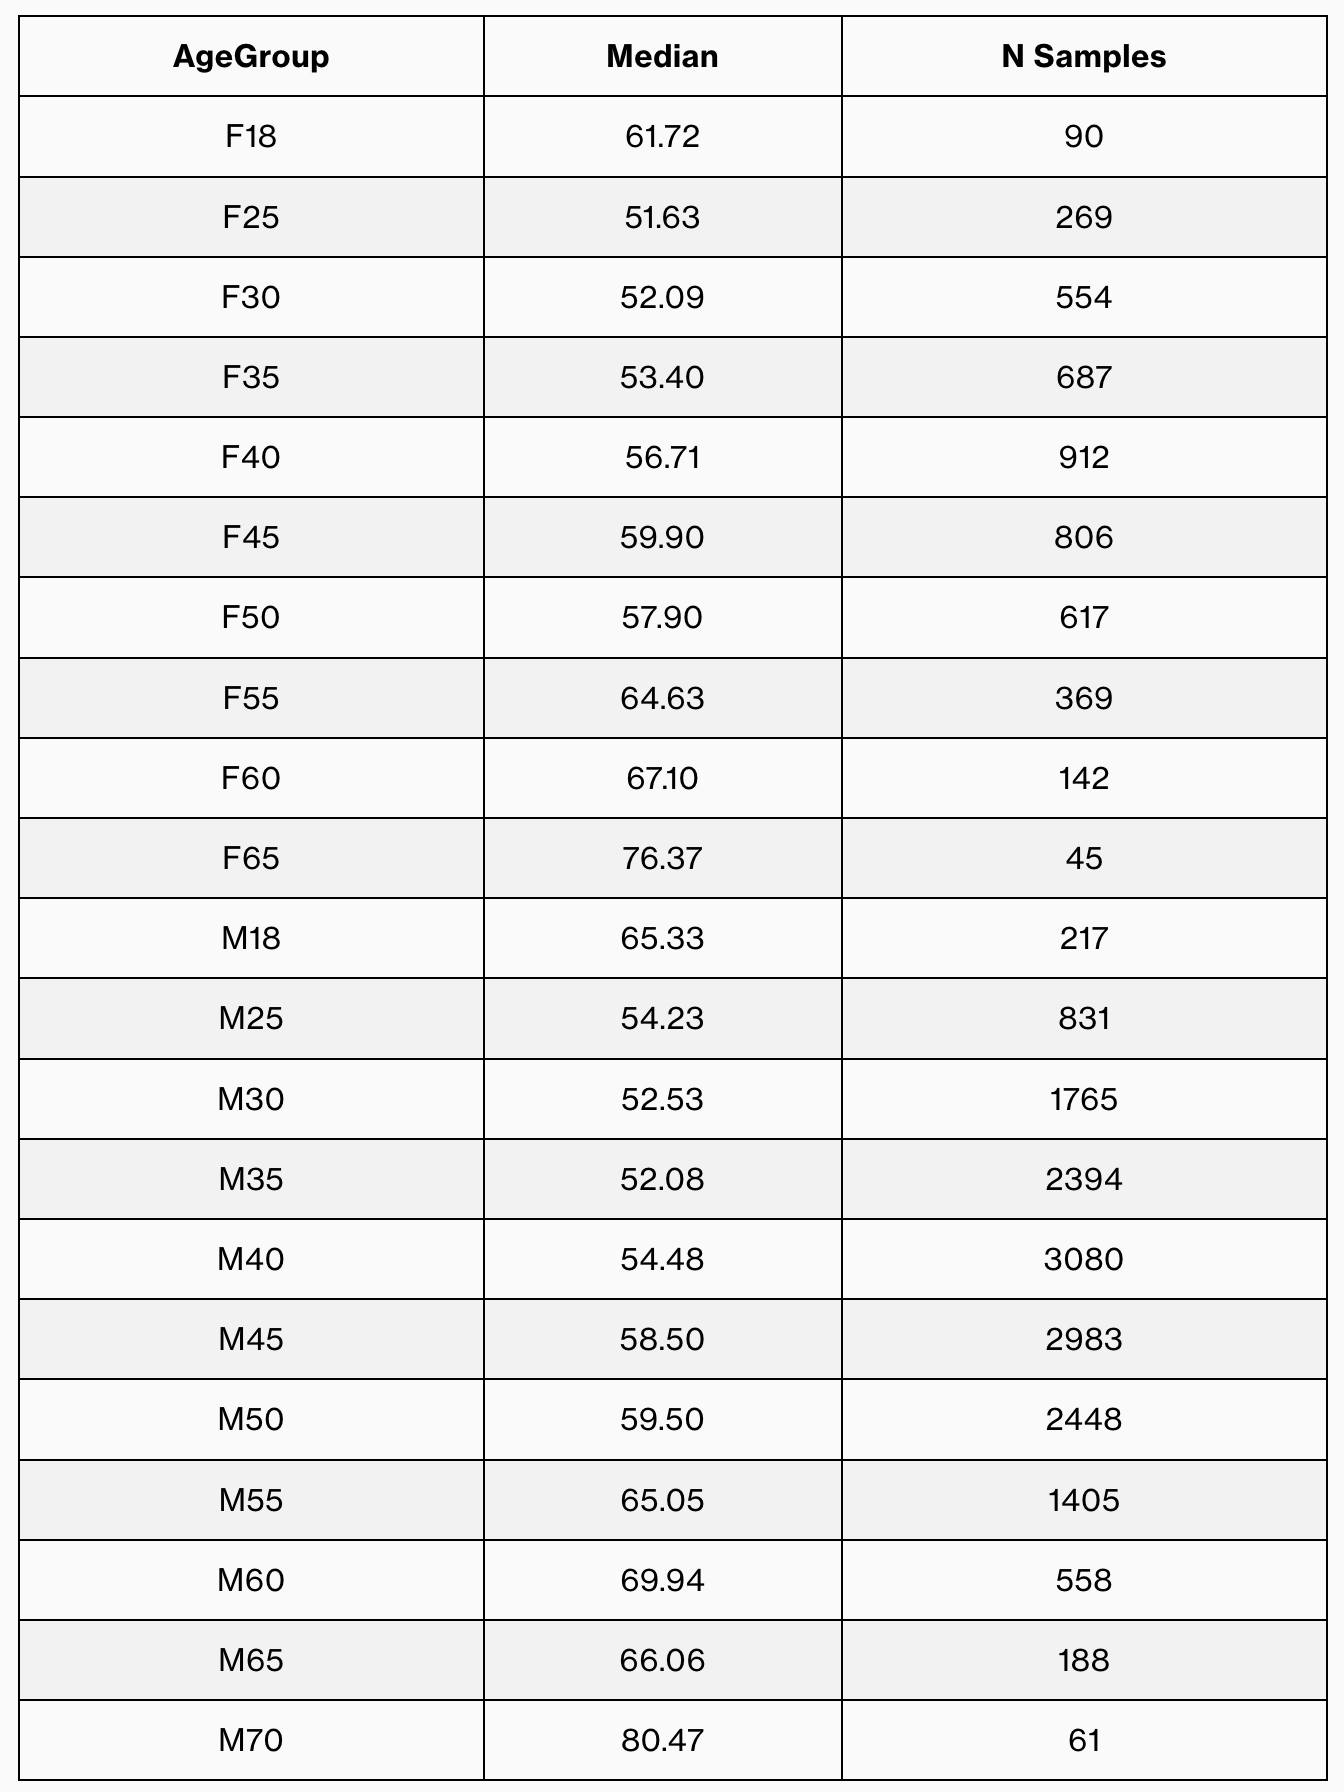
Image 2: Distribution of dataset by Age Groups
To ensure inclusion in the analysis, I specifically chose athletes who completed at least one 703 and at least one 1406 race. However, due to limitations in identifiable characteristics beyond Name, Country, and Age Group, I treated athletes with the same Name but different Age Groups as distinct data points within the model. For instance, let's consider two scenarios: within the M30-34 category, my best times were 4h40 and 10h28, whereas in the M35-39 group, my best times were 4h27 and 9h09. As a result, I am represented once for each age group, but within the overall model (regardless of age group), I am counted twice. This approach might result in some athletes having two or even three entries. Nevertheless, I deemed this acceptable as considerable performance variations can occur over an 8-year period. An individual might experience a significant speed increase from 18 to 26 years old or encounter a slowdown from 60 to 68 years old.
Furthermore, while conducting the analysis, I needed to make decisions regarding the races to include. Some athletes, including myself, participated in numerous full and half-distance races. Given the blog's aim to assist in identifying the optimal performance outcome, I chose to select the best performances for each Athlete/Age Group combination to construct the predictive model. Additionally, to focus specifically on the performance of amateur triathletes, professional and physically challenged athletes were excluded from the analysis.
Section 2: Data Segmentation and Cohorts
To ensure the relevance and applicability of this analysis to a diverse audience, I approached it from several distinct angles. Firstly, I segregated the data by gender to explore potential differences between men and women. Men typically possess larger muscle mass and fibers, potentially affording advantages in absolute strength and endurance. Conversely, women might exhibit a higher proportion of fatigue-resistant muscle fibers and could perceive fatigue differently, influencing their pacing and endurance strategies. Hormonal variations and metabolic differences, including the impact of estrogen and testosterone levels on energy metabolism and recovery, also contribute to potential disparities.
Secondly, I segmented the data by Age Group. Many existing models offer generalized guidance, yet it's widely acknowledged that a 25-year-old female may experience different time decay compared to a 60-year-old male. Age group divisions not only ensure fair competition by grouping athletes of similar ages but also facilitate comparisons within one's age category, allowing participants to benchmark their achievements.
Thirdly, I categorized the data by Continent. Personal experiences while racing in Europe—observing the remarkable depth of competition and the apparent dedication to training and preparation—prompted me to explore potential quantifiable differences between athletes from North America, Europe, and other regions. The choice of continent over country aimed to maintain larger cohorts for statistical power and the broad applicability of this analysis.
Lastly, I examined the data by 70.3 finishing time cohort. This segmentation sought to understand potential variations in fatigue resistance between different parts of the field. The intention was to uncover the differences in time decay among athletes of similar types, investigating whether there are discernible disparities between the front and tail ends of the field in terms of their propensity for fatigue resistance.
Section 3: Model Selection and Design
In this section, I'll introduce various modeling approaches before delving into the selected method that generated the results. Several authors have proposed models to predict full Ironman performance based on half Ironman performances. Notably, articles from RunTri and Triathlete.com discuss estimation methods. However, these articles often concentrate on specific races, limiting their generalizability. Personally, I've found the suggestions in these articles to be fairly accurate. Therefore, the intent behind my model is to expand upon the approach explained in the Triathlete.com 2x method.
Statistically, there are several ways to model the output. One possible framework involves estimating the 140.6 Time as a combination of 70.3 Swim, Bike, and Run Times, each multiplied by a specific weight factor. This approach has been explored in previous research but typically for predicting 70.3 times using 70.3 split times.
Estimated 140.6 Time ≈ Weight1 * 70.3 Swim Time + Weight2 * 70.3 Bike Time + Weight3 * 70.3 Run Time
This equation provides a means to reasonably predict an individual's estimated 140.6 time. In this context, the Weigh' signifies the relative contribution each split (Swim, Bike, and Run) has on the total time. A similar approach was explored in an article titled 'Predicting overall performance in Ironman 70.3 age group triathletes through split disciplines' published in Scientific Reports (nature.com). However, this method was employed solely for predicting 70.3 times using respective 70.3 split times. Undoubtedly, a similar methodology could be applied to estimate full Ironman times.
Alternatively, we could simplify this to a more straightforward model:
Estimated 140.6 Time ~= Weight1 * 70.3 Time
For instance, utilizing Ironman New Zealand, RunTri.com suggested an approximate multiplier of 2.12 times the half Ironman time for the full Ironman distance. This simplification can be represented as:
(1) Estimated 140.6 Time ~= 2.12 * 70.3 Time
To further refine this method, I propose fixing Weight1 at 2.0, assuming a consistent doubling in time from half to full Ironman. This adjustment results in a clearer model:
(2) Estimated 140.6 Time ~= 2.0 * 70.3 Time + y_minutes
Here, y_minutes represents the additional minutes to be added to a doubled 70.3 time to approximate the 140.6 time. This framework can be extended to individual splits:
(3) Estimated 140.6 Swim Time ~= 2.0 * 70.3 Swim Time + y1_minutes
(4) Estimated 140.6 Bike Time ~= 2.0 * 70.3 Bike Time + y2_minutes
(3) Estimated 140.6 Run Time ~= 2.0 * 70.3 Run Time + y3_minutes
While I will cover some initial results using the broader approach in 3-5, the primary focus of the analysis will center around modeling (2) for different cohorts, including Age Group, Gender, 70.3 Finishing Cohort, and Temperature Delta.
Section 4: Results - How to Estimate Your Full Ironman Finishing Time
In this section I will explore various aspects of triathlon performance by examining distinct parameters. This exploration encompasses five key topics that provide valuable insights into performance dynamics and variations within the triathlon domain. I will scrutinize gender differences to uncover potential disparities. Segmenting by age groups will allow for a nuanced understanding of age-related influences. Furthermore, a comparative lens will be employed to evaluate continents and their impact on performance outcomes. Additionally, I will delve into the intricacies of analyzing 70.3 finishing time cohorts, aiming to unveil the significance of finishing times on overall performance. Lastly, investigating temperature differences between 70.3 and 140.6 races will shed light on the influence of climate variations on triathlon performances.
Subsection 1: Gender Differences
Exploring the dataset initially revealed an intriguing discovery: the gender differences in triathlon performance appeared relatively subtle when considering the entire dataset holistically. As depicted in Image 3, both Men and Women showcase a strikingly similar average model: the transition from a 70.3 to Iron distance seems to adhere to a consistent pattern, averaging at about 2x the 70.3 time + 56 minutes. However, Image 3 also unveils a notable pattern termed 'blowing up,' underscoring an intriguing phenomenon where athletes, while rarely exceeding a twofold increase in time, frequently display significant slowdowns below this average estimate.
Image 3: Doubling Equation to predict 140.6 Time from 70.3 Time
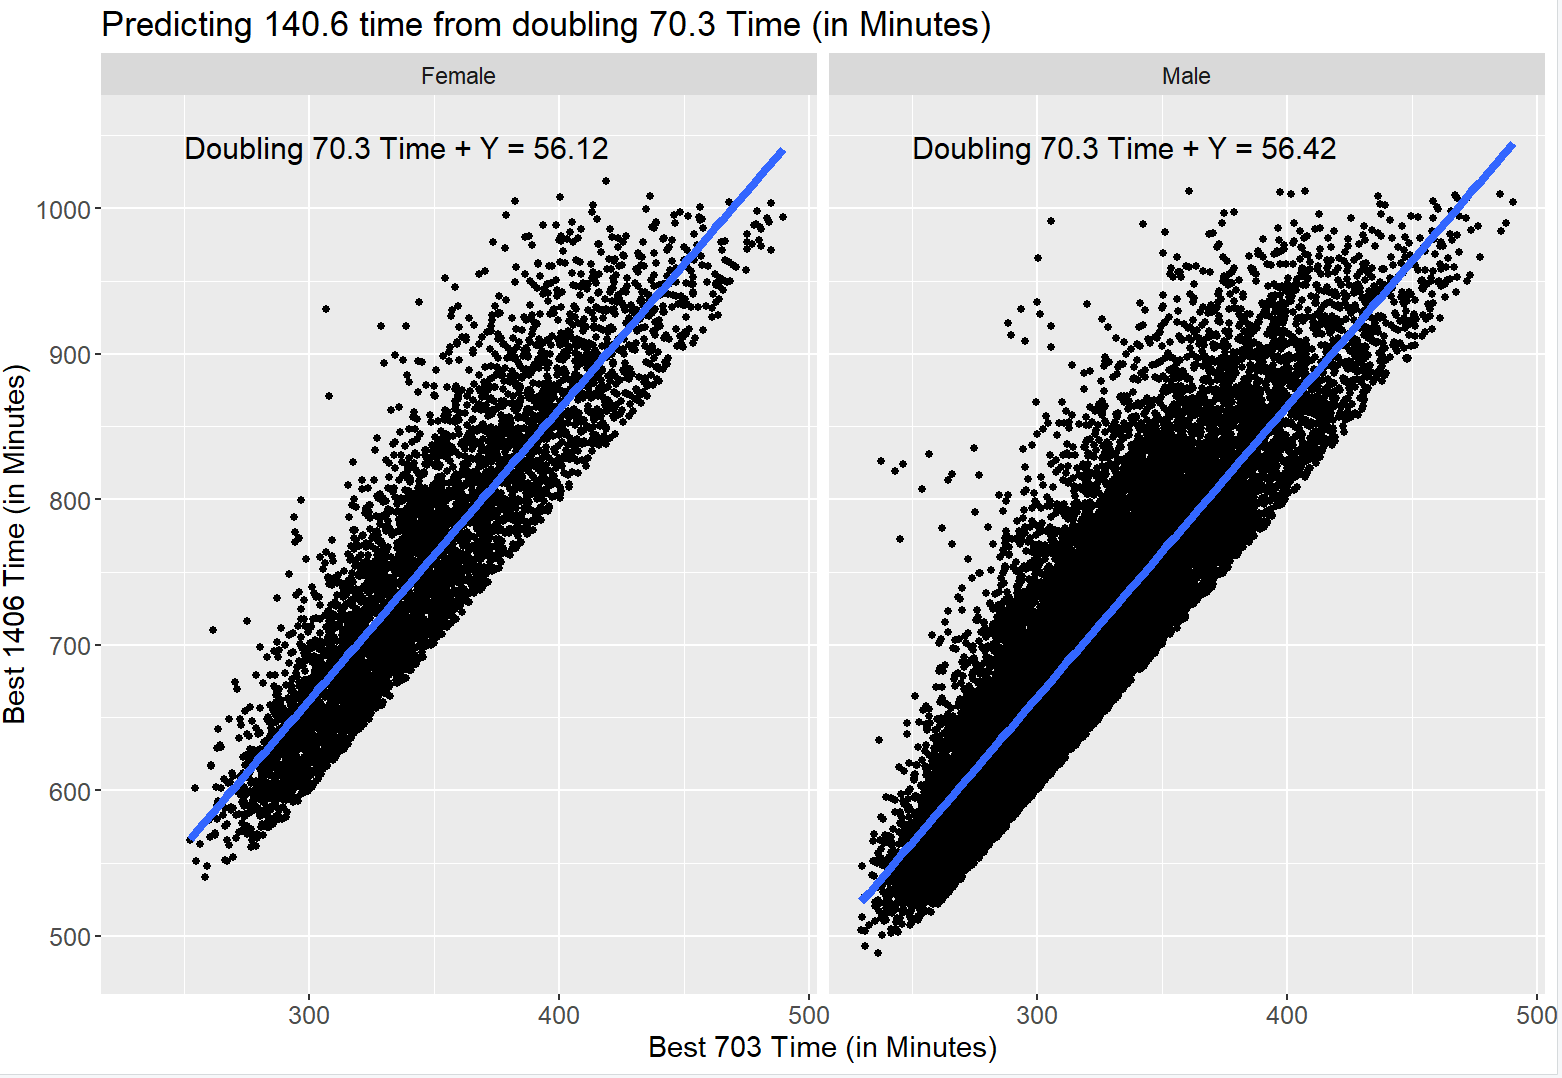
For instance, a substantial number of athletes who complete the 70.3 distance within a time frame of 350-400 minutes (5h30-6h40) seemingly struggle during the full distance, taking anywhere between 900-1000 minutes (15+ hours). This considerable discrepancy in completion times often stems from difficulties encountered during the run segment, leading to slower paces and, in some cases, necessitating walking sections.
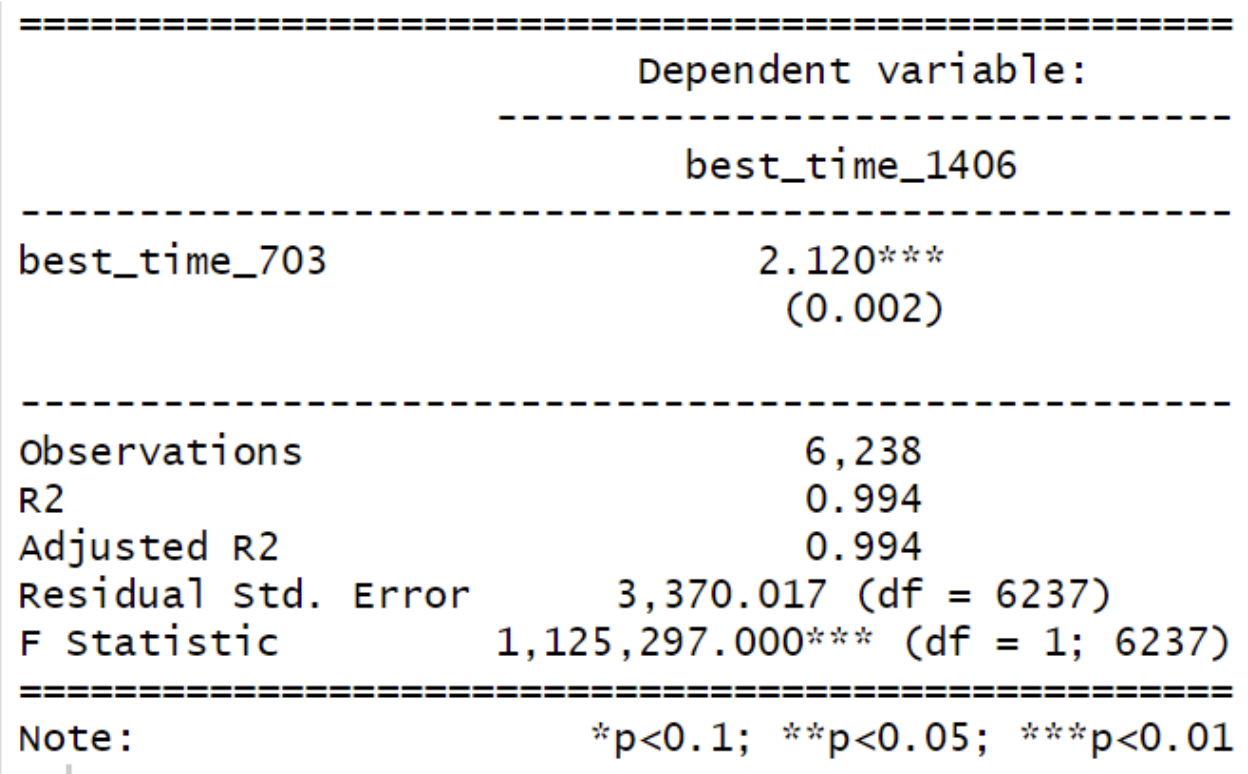
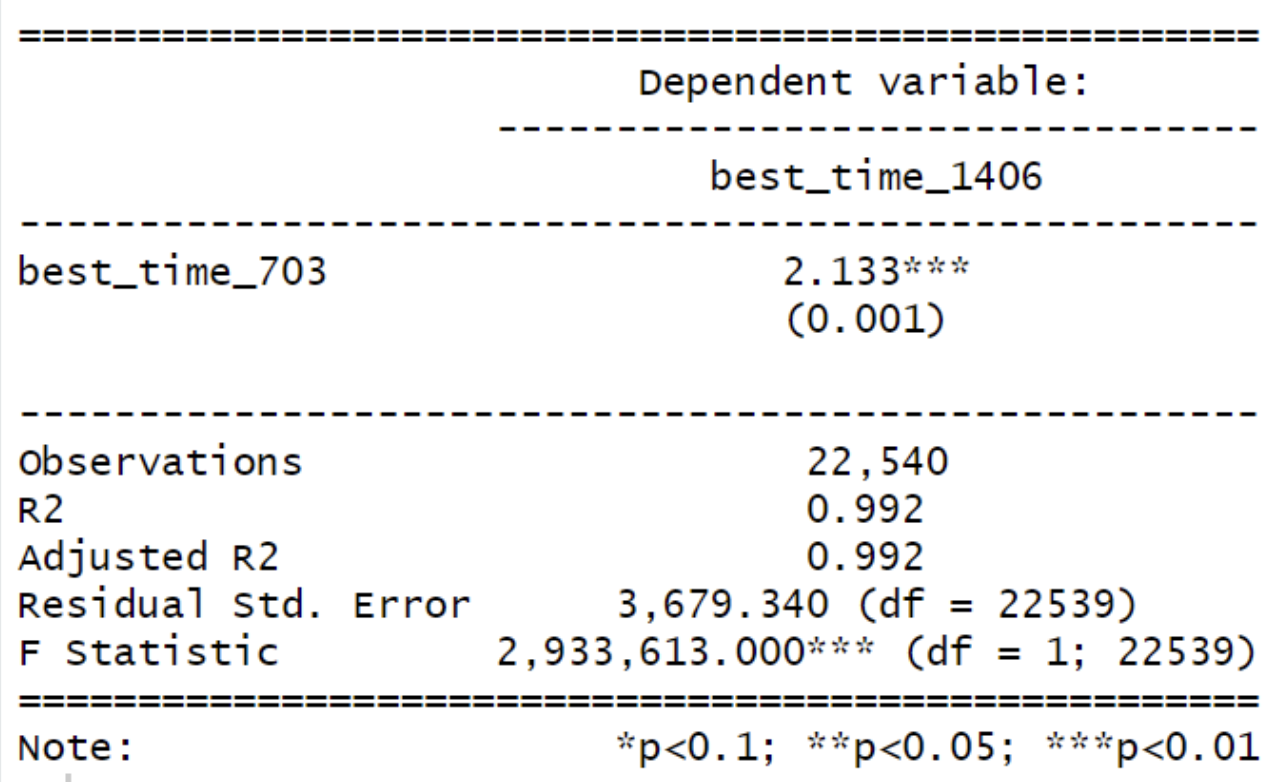
Another approach, akin to the methodology employed by RunTri.com, surfaced when considering Male athletes. This method suggests multiplying the best 70.3 time by 2.13 to estimate the corresponding best 140.6 time for Men. Impressively, this model exhibited a robust fit with an R-squared of 99%, indicating a remarkably strong alignment between predicted and actual times. Such close correspondence between predicted and observed times underscores the reliability and accuracy of this predictive model for male athletes.
Image 4: Multiplier Equations Male (left) and Female (right), the result is identical to RunTri.com:
Subsection 2: Female and Male Split Differences
Upon closer examination of gender differences, it's valuable to dissect each segment comprising the Swim, Bike, and Run disciplines. Focusing on the Swim, females showcase a smaller variance of 1.5 minutes compared to males at 1.78 minutes. Generally, individuals tend to lag only about 1-2 minutes behind after doubling their Swim time. Intriguingly, there's a subset of athletes who excel in longer Swim distances, with 90% of participants finishing within the range of 2x -5 min and 2x + 9 min concerning their best 70.3 time during their peak 140.6 performance.
Image 5: Female and Male Swim Split Differences
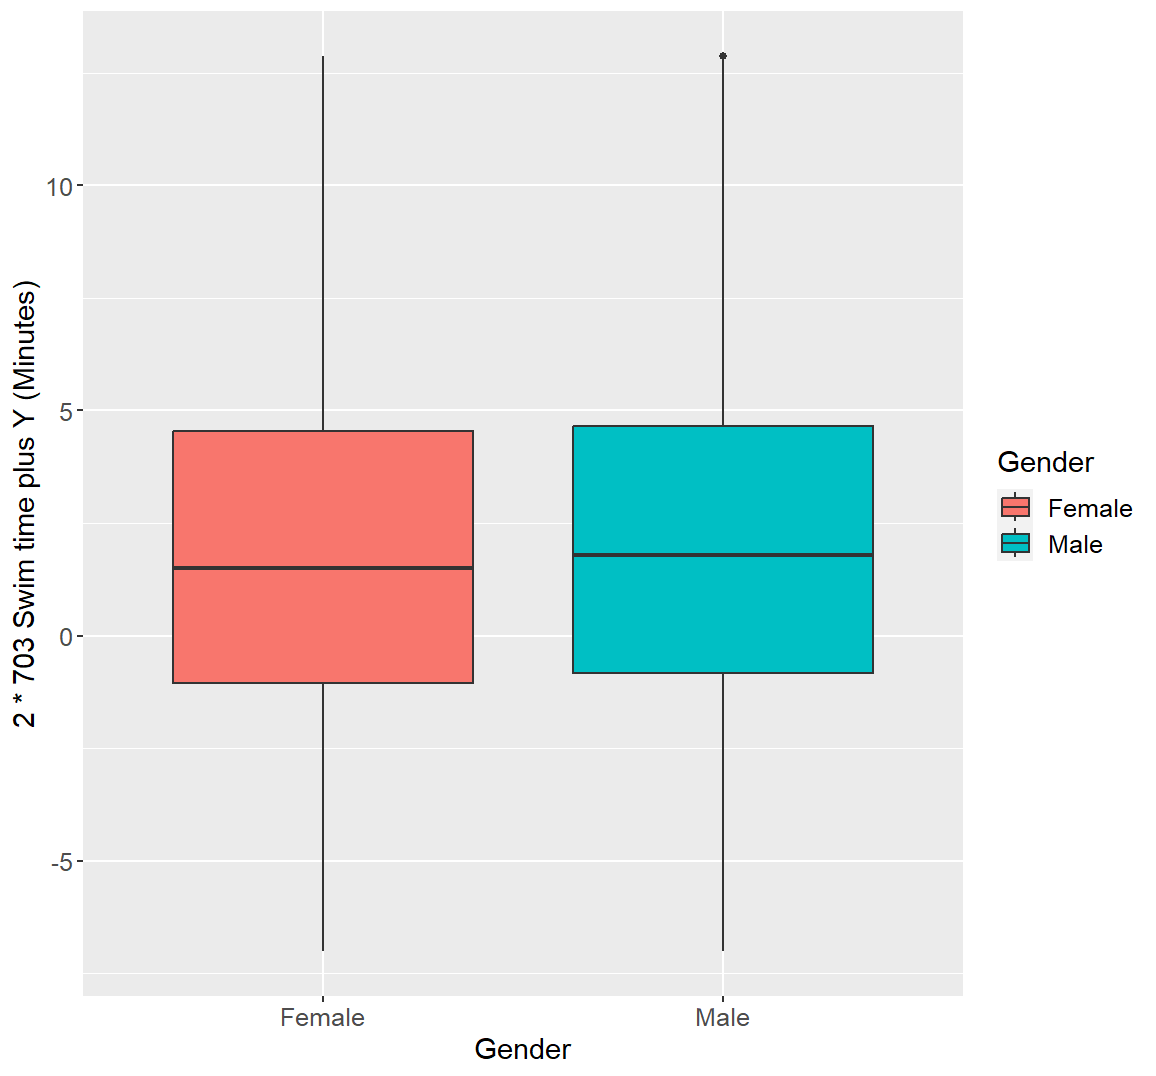
Table 1: Time Differences in Swim Split After Doubling 70.3 Time, by Gender

In the context of the Bike split, females display a slightly larger decrease compared to males, experiencing a slowdown of 25.6 minutes versus 22.62 minutes for males after doubling their best 70.3 bike split. It's worth noting that a subset of athletes demonstrates improved performance in a longer bike segment. Approximately 90% of participants finish their best 140.6 performance within the range of 2x -10 min and 2x + 60 min concerning their best 70.3 bike split. This variability might be influenced by factors such as course terrain, weather conditions, and potential advancements in an individual's skill set.
Image 6: Female and Male Bike Split Differences
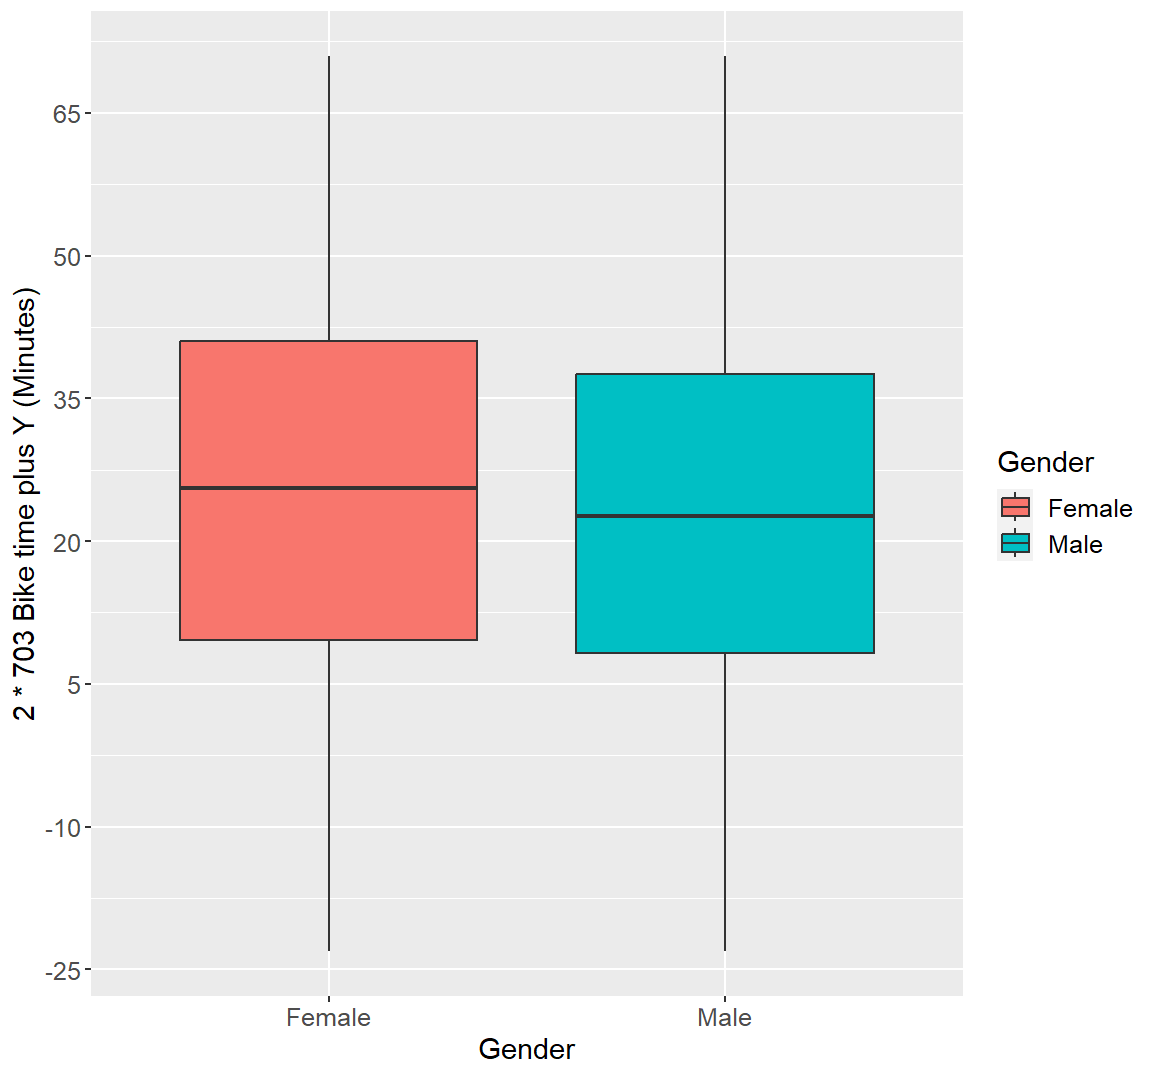
Table 2: Time Differences in Bike Split After Doubling 70.3 Time, by Gender
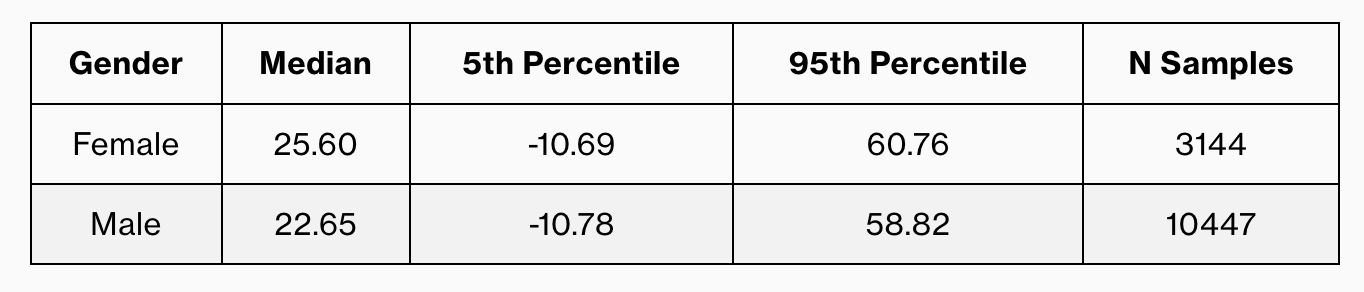
In terms of the Run Split, there's a noticeable distinction in performance decline between males and females. On average, males exhibit a slowdown that's three minutes greater after doubling their 70.3 run split in comparison to females. Looking at the 95th percentile of individuals experiencing the most deceleration, males show a staggering 1 hour and 15 minutes reduction in their running pace after doubling their time. To illustrate, if an individual runs a 2-hour 70.3 race, they might anticipate completing a 5-hour and 15-minute 140.6 race for the same distance. Conversely, the top 5% of runners experience a milder slowdown, only between 11 to 13 minutes, resulting in a 4-hour and 12-minute split for the 140.6 distance if they've run a 2-hour 70.3 race.
Image 7: Female and Male Run Split Differences
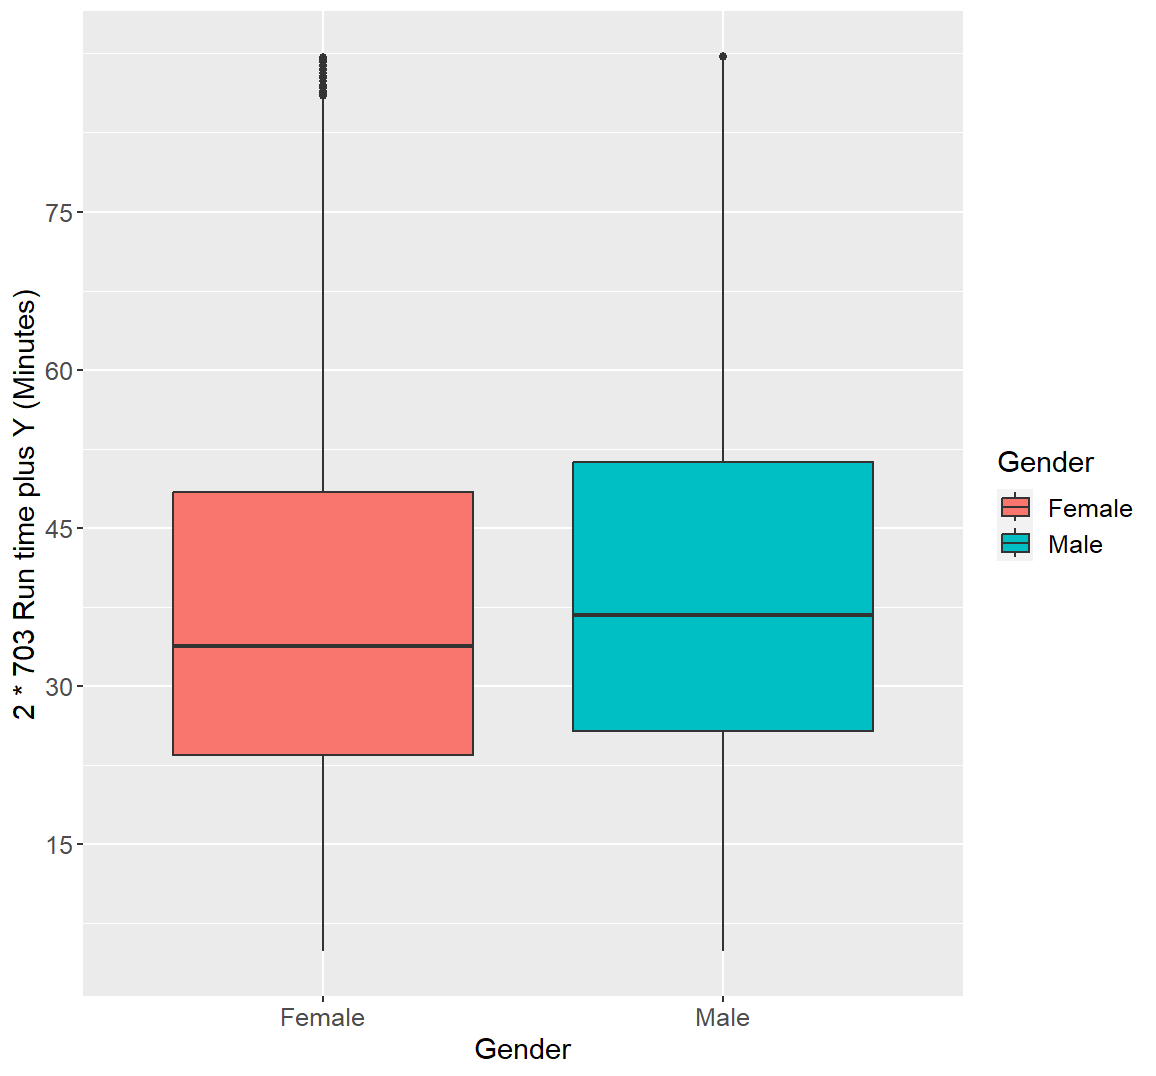
Table 3: Time Differences in Run Split After Doubling 70.3 Time, by Gender
Section 4: Cohort Analysis
This section encompasses a thorough examination of several key aspects. It begins by analyzing data by age groups to understand performance variations across different life stages. Moving on, it compares athletes from various continents, aiming to quantify potential differences in training approaches and race preparedness. Lastly, it investigates finishing time cohorts within the 70.3 race, exploring how fatigue resistance might differ among athletes of the same type.
Subsection 1: Segmenting by Age Groups
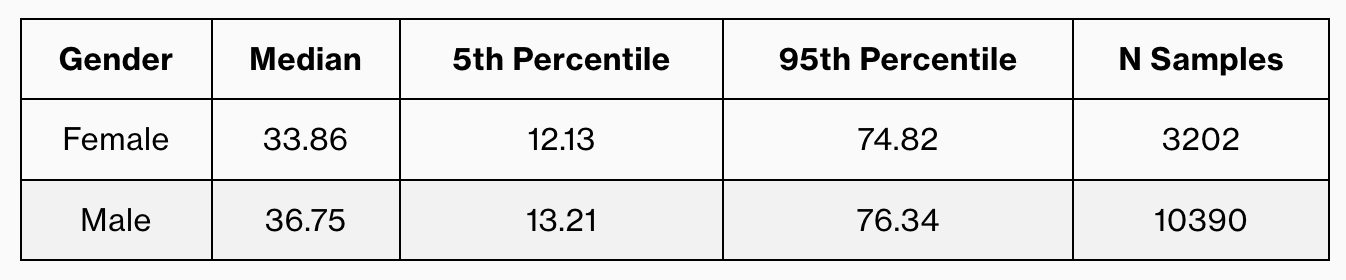
Breaking down finishing times by Age Groups can reveal substantial insights. This segmentation often illustrates how performance evolves across various life stages and fitness levels. This analysis allows us to discern whether age is a significant factor influencing performance decay or endurance across the swim, bike, run, and overall completion times in the triathlon events.
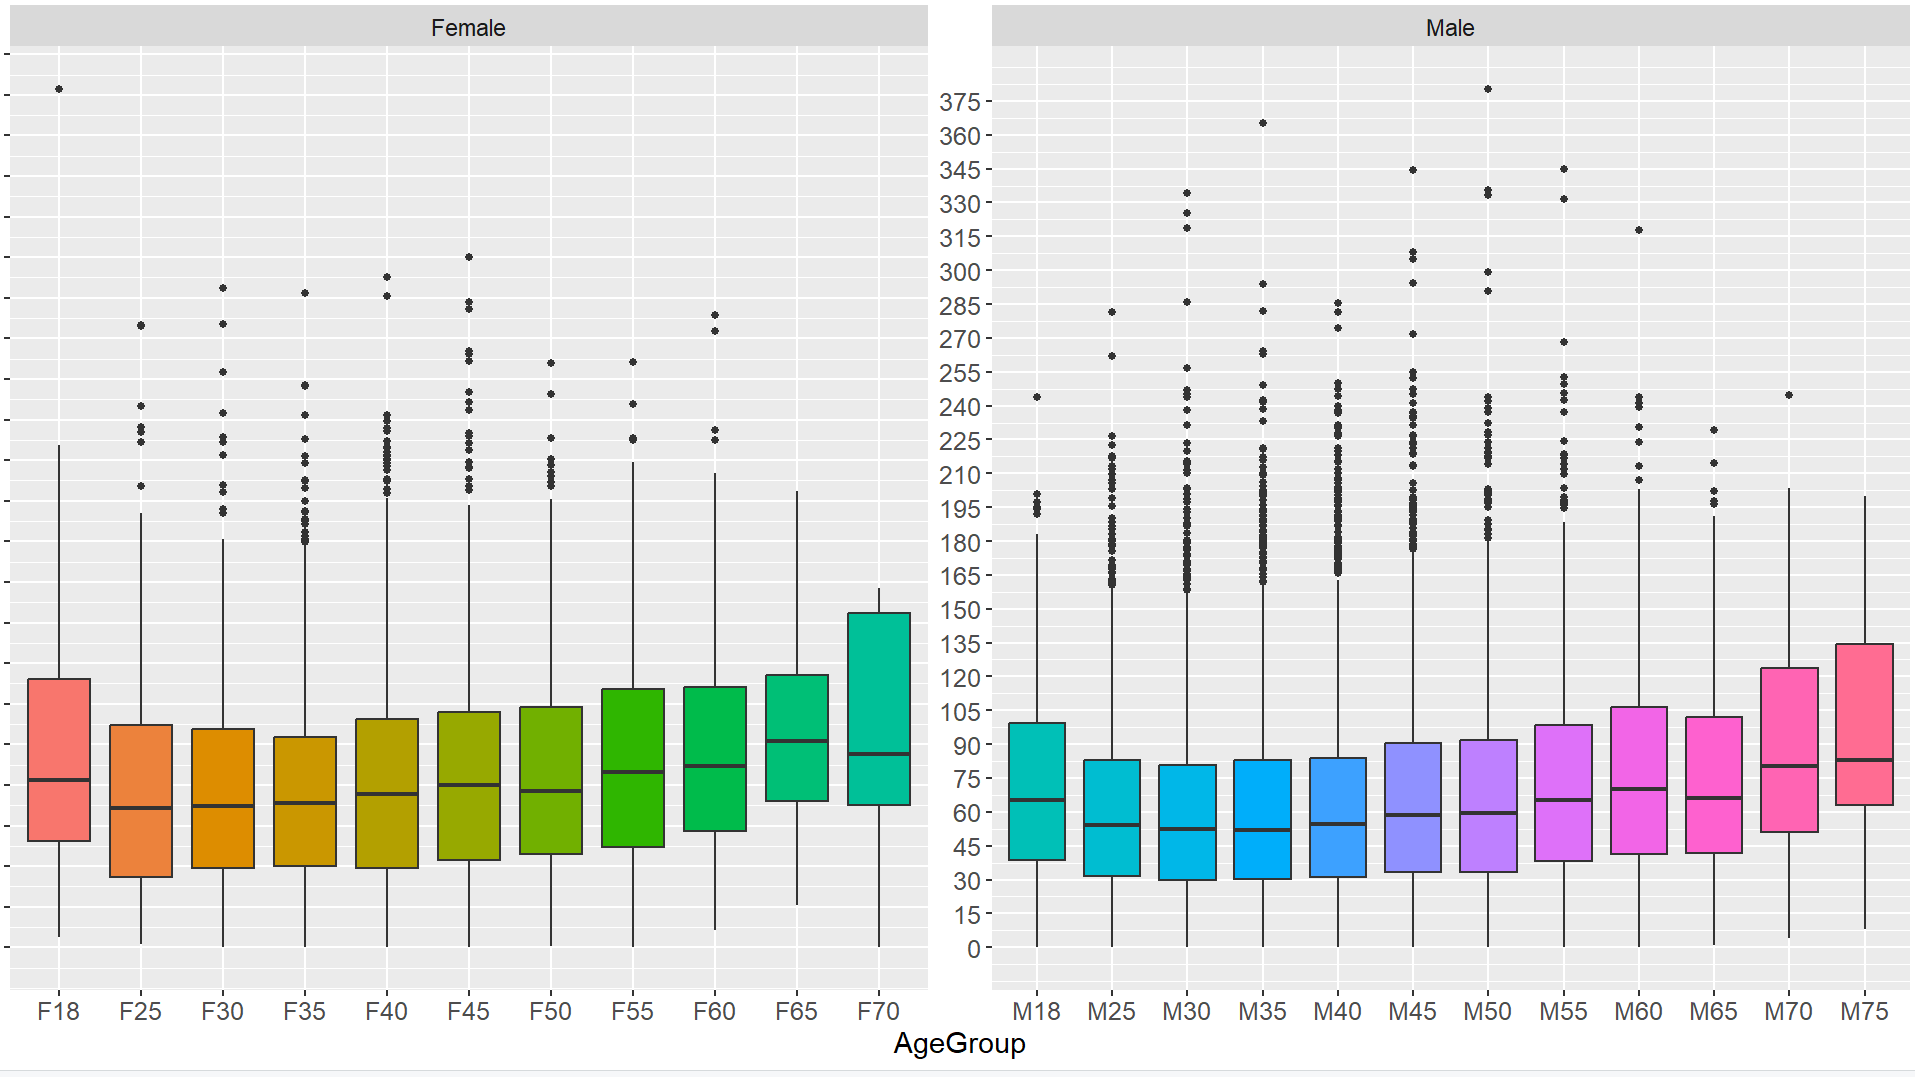
Image 8: Female and Male Age Group Finishing Time Differences
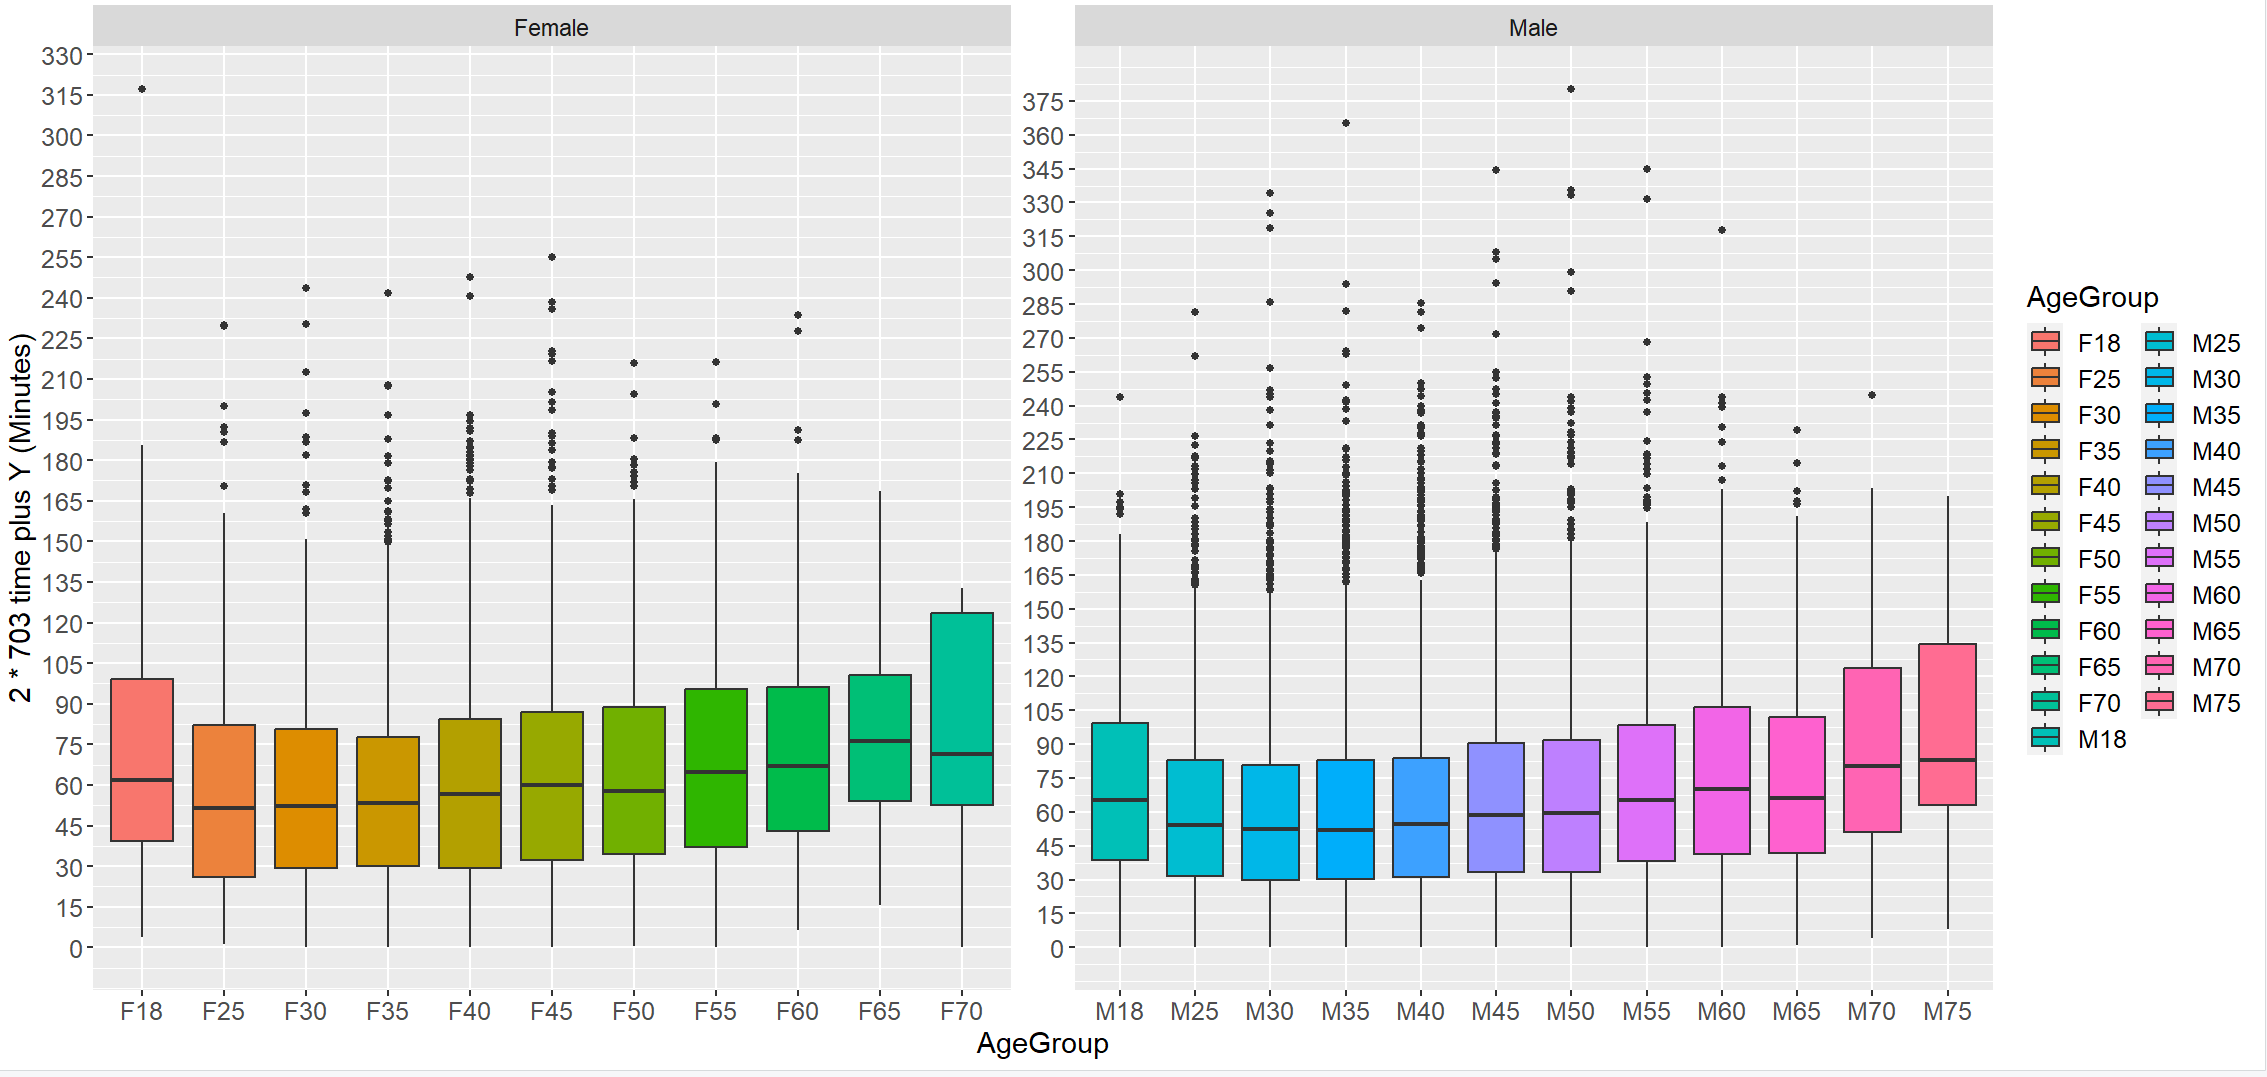
Regarding the overall finishing times, a distinct U-shaped pattern emerges, demonstrating diminished performance in both the youngest and oldest age groups. The female age group displaying the most commendable performance is F25, showcasing a 51-minute decrease after doubling. Correspondingly, the male age groups of M30 and M35 exhibit a similar 52-minute decrease. Intriguingly, it is noteworthy that M18 displays a decay comparable to that of M55.
Subsection 2: Segmenting by Continent of Origin
Within continents, there appears to be a parallel in performance between men and women. This similarity within continents contrasts with the disparities observed between different continents. For instance, North American men experience a slowdown of 68 minutes, slightly more than North American women who slow down by 63 minutes, aligning with the gender comparison highlighted in Section 1. Similarly, among European participants, men exhibit a slowdown of 46 minutes, while women show a slowdown of 40 minutes. A similar trend of almost identical time decay between men and women is evident in both Oceania and South America.
A notable mention goes to the North American women. Despite their finishing times slightly lagging behind those of European women when transitioning from 703 to 1406, approximately three times as many North American women have completed both the 703 and 1406 distances compared to their European counterparts.
Image 9: Female and Male Finishing Time Differences by Continent of Residence
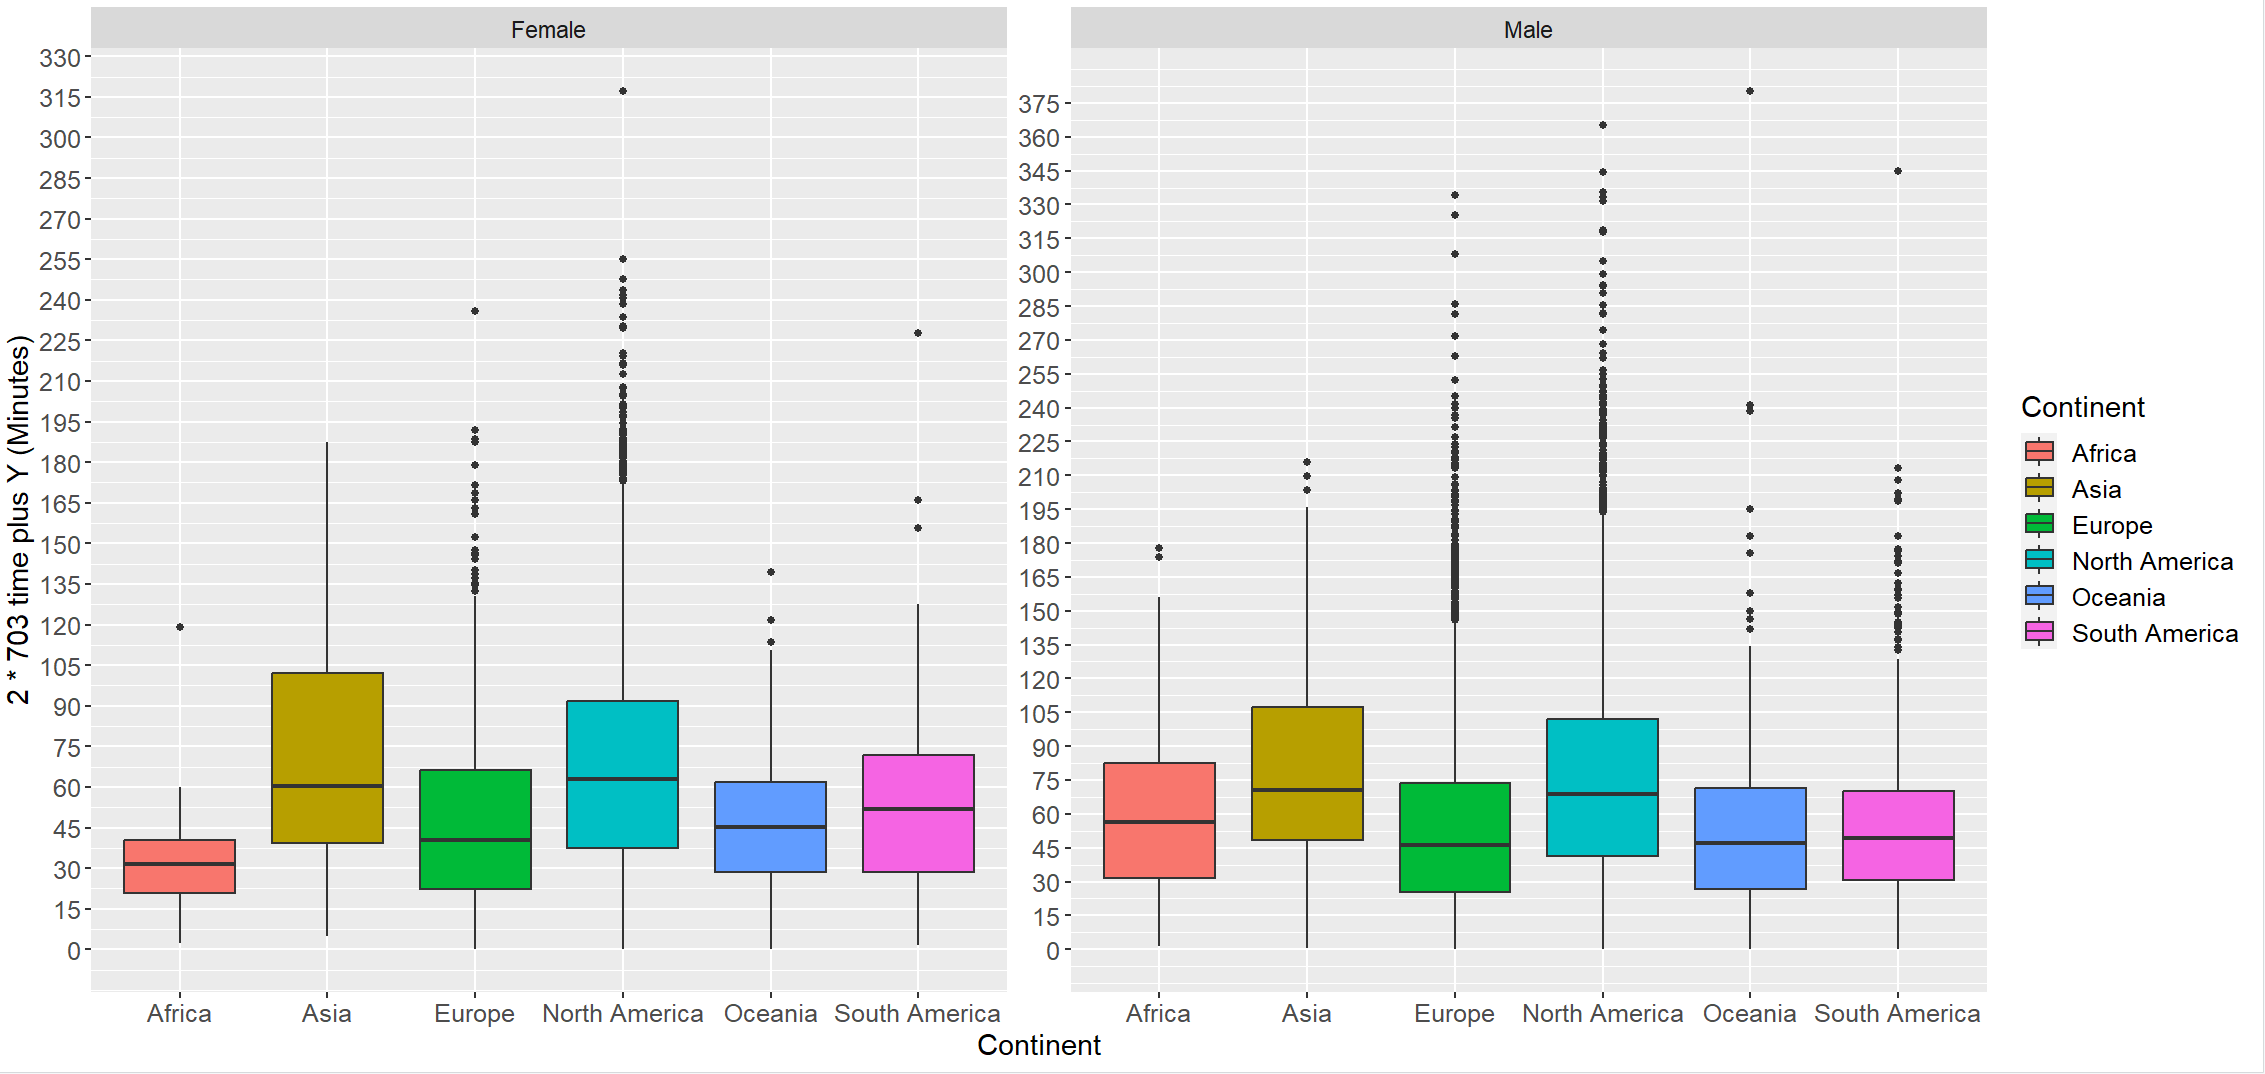
Table 4: Time Differences in Finish Time After Doubling 70.3 Time by Gender, Continent

Subsection 3: Segmenting by 70.3 Finishing Time Cohorts
To arrive at these findings, individuals were grouped into cohorts based on their best finishing times in the 70.3 distance. For instance, if someone completed a 70.3 race in 4h22, they would fall into the 4.25 to 4.5-hour cohort. The observed patterns here align with our expectations. Faster racers tend to display smaller performance declines compared to slower racers. For instance, within the 4.25 to 4.5-hour cohort, males slow down by 47 minutes, while females exhibit a slowdown of 53 minutes. These decelerations are less severe compared to the average slowdown for males and females across the general population, which was around 56 minutes. Consequently, within this cohort, males are experiencing a 17% smaller slowdown than the average for males, while females are experiencing a 6% smaller slowdown than the average for females.
One possible explanation for gender differences is that there are differences in the way that males and females experience performance decay. For example, it is possible that females are more likely to experience performance decay due to hormonal changes or other physiological factors. Additionally, there may be psychological factors that contribute to performance decay, such as anxiety or stress. More research is needed to fully understand the relationship between finishing time, gender, and performance decay. However, this data provides a valuable starting point for further investigation.
Image 10: Female and Male Finishing Time Differences by 70.3 Finishing Time Cohorts
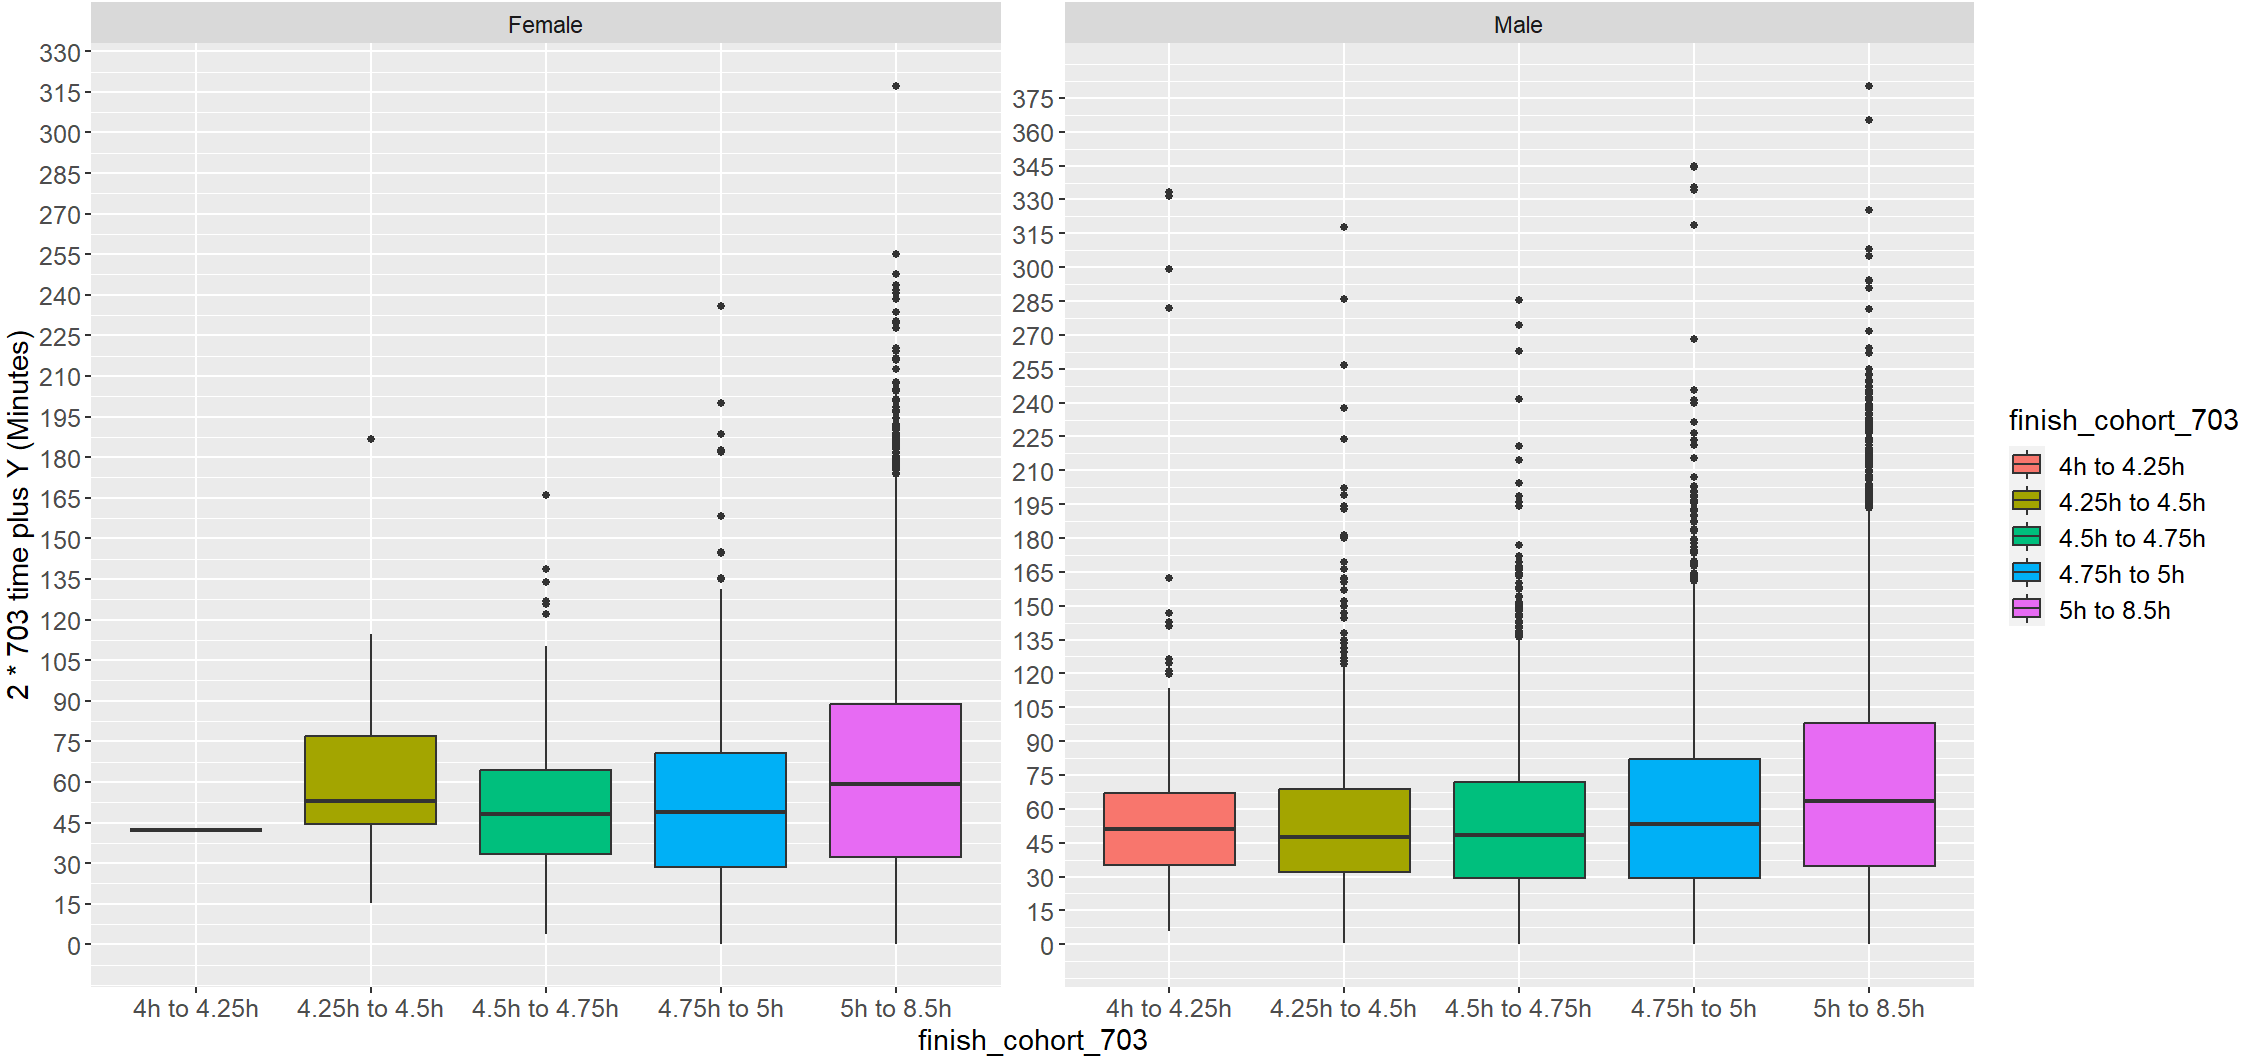
Table 5: Time Differences in Finish Time After Doubling 70.3 Time by 70.3 Finishing Time Cohorts

Subsection 4: Investigating temperature differences between 70.3 and 140.6 Races
In this section, individuals were categorized into cohorts based on the difference in temperature between the average temperature on the date and location of their best 70.3 and 140.6 performances. For instance, if someone achieved their best 140.6 finishing time at IMTX with an average temperature of 20°C and their best 70.3 finishing time at IM703 Oceanside with an average temperature of 15°C, the temperature delta would be 20 - 15 = 5°C. Consequently, they would fall into the (4.3 - 8.23] bin, indicating that they raced their best 140.6 in a warmer climate compared to their best 70.3. A positive numbered cohort signifies that the 140.6 race was warmer.
Examining the most extreme differences first, when the temperature during the 140.6 race is significantly colder than the 70.3, females exhibit a slowdown of 67 minutes, whereas males slow down by 50 minutes. Conversely, in the opposite scenario where the 140.6 race is much warmer, females show a slowdown of 124 minutes, while males exhibit a slowdown of 65 minutes. As anticipated, when the 140.6 race temperature is cooler than the 70.3 race temperature, the overall trend indicates a smaller performance decay. It appears that men achieve their best performances when the full-distance race is significantly cooler than the 70.3 where the delta is -19 to -15 degrees, but this conclusion is based on a limited sample size of only 27 finishers. For women, their optimal performance seems to occur when the temperature delta ranges from -11 to -3 degrees.
Analyzing the data further, it's evident that the most common situation, as indicated by the number of finishers in the cohort, involves similar race conditions for both the full and half distances, and the performance decay in this scenario aligns with the typical performance decay observed for genders overall. Overall, there's a general increasing trend from cooler to warmer temperatures, suggesting that to improve over the average decay, selecting a cooler 140.6 race might yield better results.
Image 11: Female and Male Finishing Time Differences by Temperature Delta
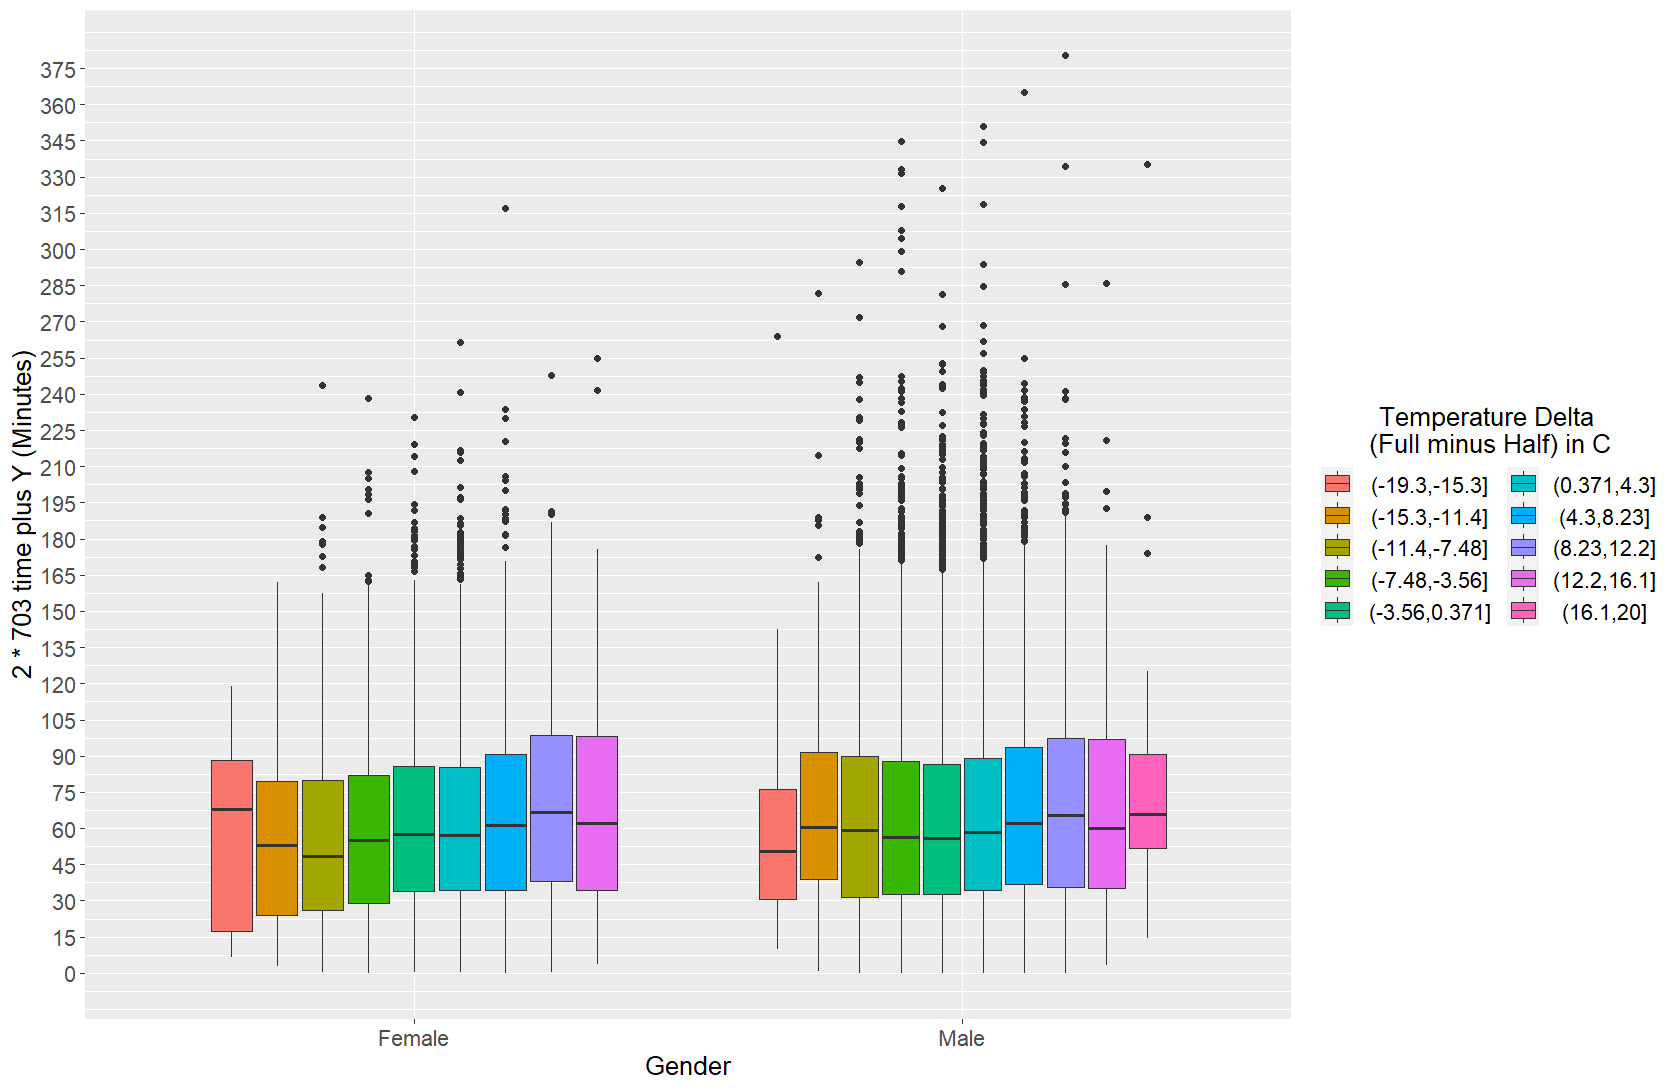
Table 6: Time Differences in Finish Time After Doubling 70.3 Time by Temperature Delta
Section 5: Combined Cohort Analysis
Combining some of the earlier analyses allows us to explore potential interactions between the 70.3 finishing cohort and age group. However, it's important to note that due to relatively small sample sizes, there is noticeable variance, as evidenced by the considerable height of the boxplots. A distinct U-shaped trend is observable, particularly among male finishers within each cohort.
In the most extensive cohort ranging from 5 to 8.5 hours, we observe that older age groups display the most significant decline in performance. Notably, the M35-40 age group appears to exhibit the most resilience against fatigue in this context. On the female side, the F30-35 age group demonstrates the strongest performances when comparing their 70.3 and 140.6 times.
Image 12: Female and Male Finishing Time Differences by 70.3 Finishing Cohort and AgeGroup
A comparative analysis of athletes by continent and 70.3 finishing cohort reveals that European women consistently outperform their North American counterparts in terms of relative 70.3 and 140.6 performances. This trend is also evident among males, with the exception of the 4-hour to 4.25-hour cohort, where European and North American men exhibit nearly identical performance decay.
As the finishing cohort extends beyond 4.25 hours to 4.5 hours and beyond, the disparity between men from the two continents becomes more pronounced. In the 5-hour to 8.5-hour cohort, there's an approximate 30-minute difference in performance decay between European and North American men. As expected, a smaller variance is observed in the faster age groups.
Image 12: Female and Male Finishing Time Differences by 70.3 Finishing Cohort and Continent
Section 6: Key Takeaways
An examination of athlete performance across continents in 70.3 and 140.6 races revealed discernible disparities between athletes from distinct geographical regions. Notably, athletes from certain continents showcased superior performance relative to their counterparts. European athletes consistently displayed stronger performances compared to North American athletes across both genders in the 70.3 and 140.6 distances. Moreover, this performance discrepancy amplified notably as race durations exceeded the 4.5 hour mark, signifying a widening performance gap between athletes from different continents as race lengths extended.
Age emerged as a pivotal determinant of performance variation among athletes participating in the dataset. Observable trends showcased a notable decline in performance among older age groups when compared to their younger counterparts. This decline was particularly large within the 70.3 cohort spanning 5 to 8.5 hours, underscoring the influence of age on endurance race outcomes.
Furthermore, a discernible pattern emerged highlighting the differential impact of race pace on performance decay. Faster racers consistently exhibited relatively smaller performance declines compared to slower racers. This trend underscores the significance of race pace as a determinant factor influencing performance in longer endurance events.
Gender-based performance distinctions were evident across various race segments. Notably, within the run split, males experienced a more pronounced decrease in performance compared to females. Conversely, in the bike split, females showcased a slightly larger performance decay in contrast to their male counterparts. Similarly, in the swim split, females displayed a smaller performance difference compared to males, highlighting nuanced gender-based variations across race segments.
Section 7: Sensitivity Analysis
Survivorship bias encapsulates the inherent distortion within a dataset, stemming from the exclusive inclusion of successful entities or individuals who completed a given process or event. This bias often leads to an incomplete or overly optimistic understanding of the challenges and outcomes associated with the event or process under investigation.
In the context of endurance races like triathlons, this bias manifests prominently due to the dataset's exclusion of individuals who did not finish the race, particularly in physically demanding or extreme conditions. For instance, in races characterized by exceptionally harsh conditions such as high temperatures reaching 40 degrees Celsius, participants who struggled or couldn't maintain pace might not be accounted for in the dataset due to a 'Did Not Finish' (DNF) status. Consequently, the dataset predominantly represents athletes who successfully completed the race, potentially skewing the perceived difficulty or challenge level of the event.
Mitigating survivorship bias within such datasets involves attempting to compensate for the missing information by utilizing athletes' best times in both shorter and longer races (e.g., comparing times in a half Ironman versus a full Ironman). This comparative analysis seeks to minimize the impact of anomalous or extreme conditions that might have influenced one race but not the other.
However, it's crucial to acknowledge that despite such adjustments, the dataset might still portray a more optimistic or favorable perspective, particularly in races where numerous participants did not finish due to the severity of the conditions. Thus, interpretations drawn from such data should be approached cautiously, recognizing the potential overestimation of favorable outcomes and the likelihood that the true difficulty level of the race might be understated due to the absence of those who did not complete the event.
For future research, I propose examining the effect of Race Experience on Performance Decay. Analyzing how athletes' performance decay varies based on their exposure to either more 70.3 or more 140.6 races could yield intriguing insights. Exploring whether athletes with a higher frequency of either 70.3 or 140.6 races display different patterns of performance decline during the transition between race distances could shed light on the impact of race experience on endurance and fatigue management.
Additionally, investigating the influence of Race Location on Performance Decay presents an interesting avenue. Shifting the focus from participants' home countries to the specific race country could offer a nuanced perspective. Examining how race location impacts performance decay in triathlon events, considering factors like climate, terrain, and course difficulty, may provide valuable context regarding the influence of environmental variables on athletes' endurance and race outcomes.
Section 8: Conclusion
Precision is paramount in triathlon planning. Estimating Ironman durations from half-distance performances is key for meticulous prep. Our analysis unveils gender disparities: males falter in the run, females in biking. Age matters—youngest and oldest struggle, yet F25 and M30 shine.
Geography influences outcomes. Europeans outpace North Americans, especially in longer races. Pace matters too—faster racers endure better. Weather significantly impacts performance between 70.3 and 140.6 races.
But, we acknowledge limitations. Our dataset skews to successful finishers, possibly understating race difficulty. Caution is warranted in interpreting insights, as we might overestimate success and miss the true challenges faced by non-finishers.
Section 9: References
-
Kenney, W. L. (1985). A review of comparative responses of men and women to heat stress. Environmental Research, 37(1), 1-11. https://doi.org/10.1016/0013-9351(85)90044-1
-
Hunter, S. K. (2014). Sex differences in human fatigability: mechanisms and insight to physiological responses. Acta Physiologica (Oxford), 210(4), 768-789. doi: 10.1111/apha.12234
-
Le Mat, F., Géry, M., Besson, T., Ferdynus, C., Bouscaren, N., & Millet, G. Y. (2023). Running Endurance in Women Compared to Men: Retrospective Analysis of Matched Real-World Big Data. Sports Medicine, 53(4), 917-926. doi: 10.1007/s40279-023-01813-4
-
"Predicting Your Ironman Finish Time, Based on Half Ironman 70.3 Results." RunTri. Retrieved November 15, 2023, from https://www.runtri.com/2010/08/ironman-vs-half-ironman-factors-for.html
-
Bevis, B. (2022, July 21). "How to Estimate Your Triathlon Finishing Time." Triathlete. Retrieved November 15, 2023, from https://www.triathlete.com/training/race-tips/estimate-triathlon-finishing-time/
-
Nikolaidis, P. T., Valero, D., Weiss, K., Villiger, E., Thuany, M., Sousa, C. V., Andrade, M., & Knechtle, B. (2023). Predicting overall performance in Ironman 70.3 age group triathletes through split disciplines. Scientific Reports, 13, Article number: 11492.
-
Daniels, J. (2013). Daniels' Running Formula. Champaign, IL: Human Kinetics.